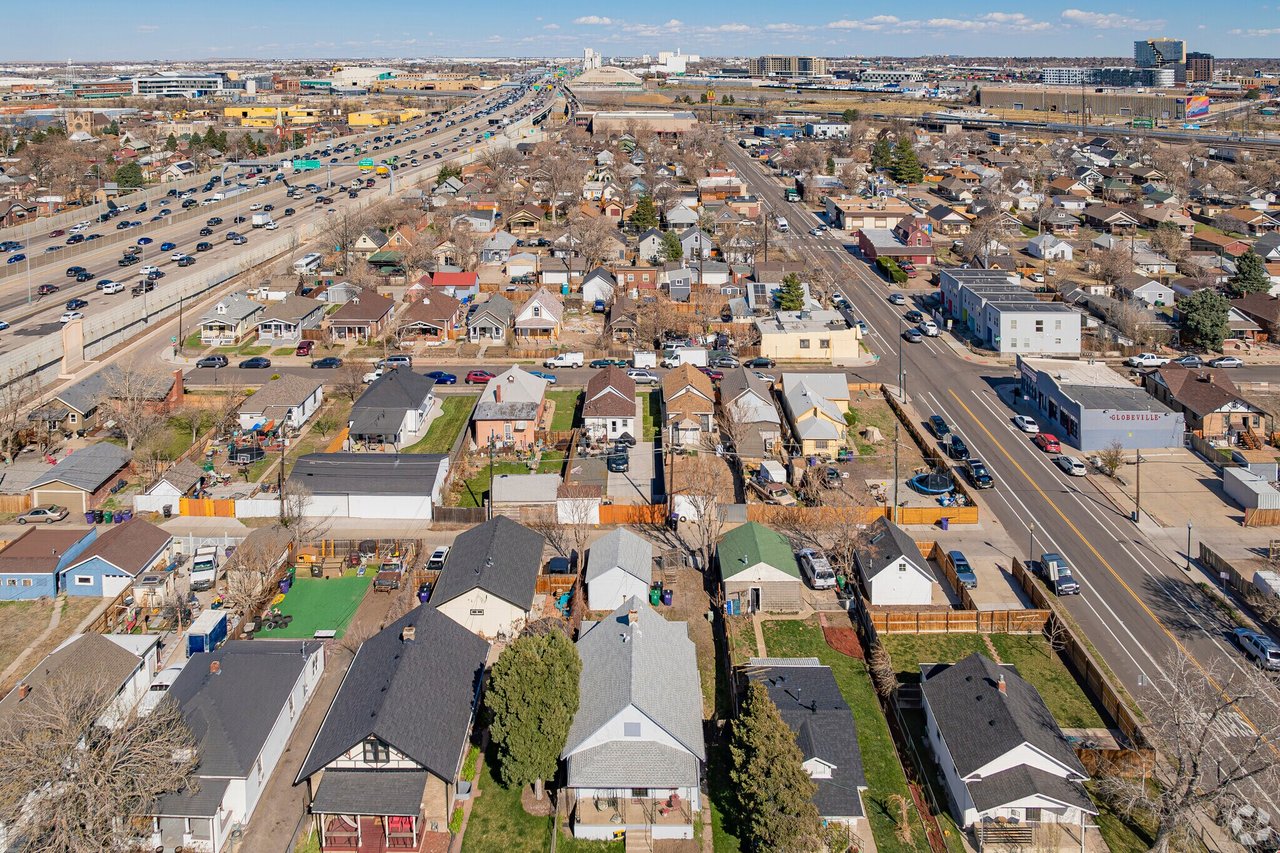
Globeville, Denver, Colorado
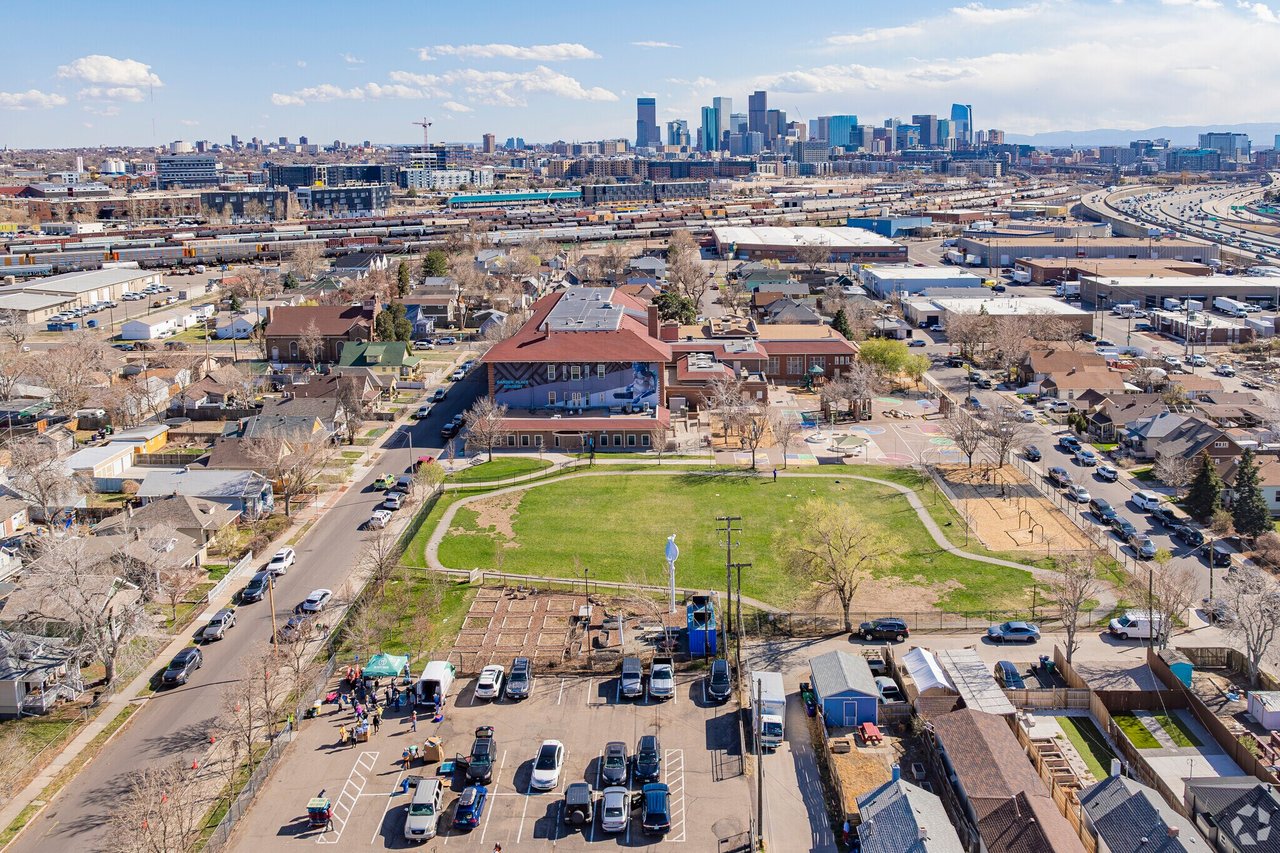
Globeville is a historic neighborhood just north of downtown Denver, known for its industrial roots, cultural depth, and ongoing revitalization. With a strong sense of identity and access to city and outdoor amenities, Globeville offers a compelling mix of tradition and transformation.
Why Globeville?
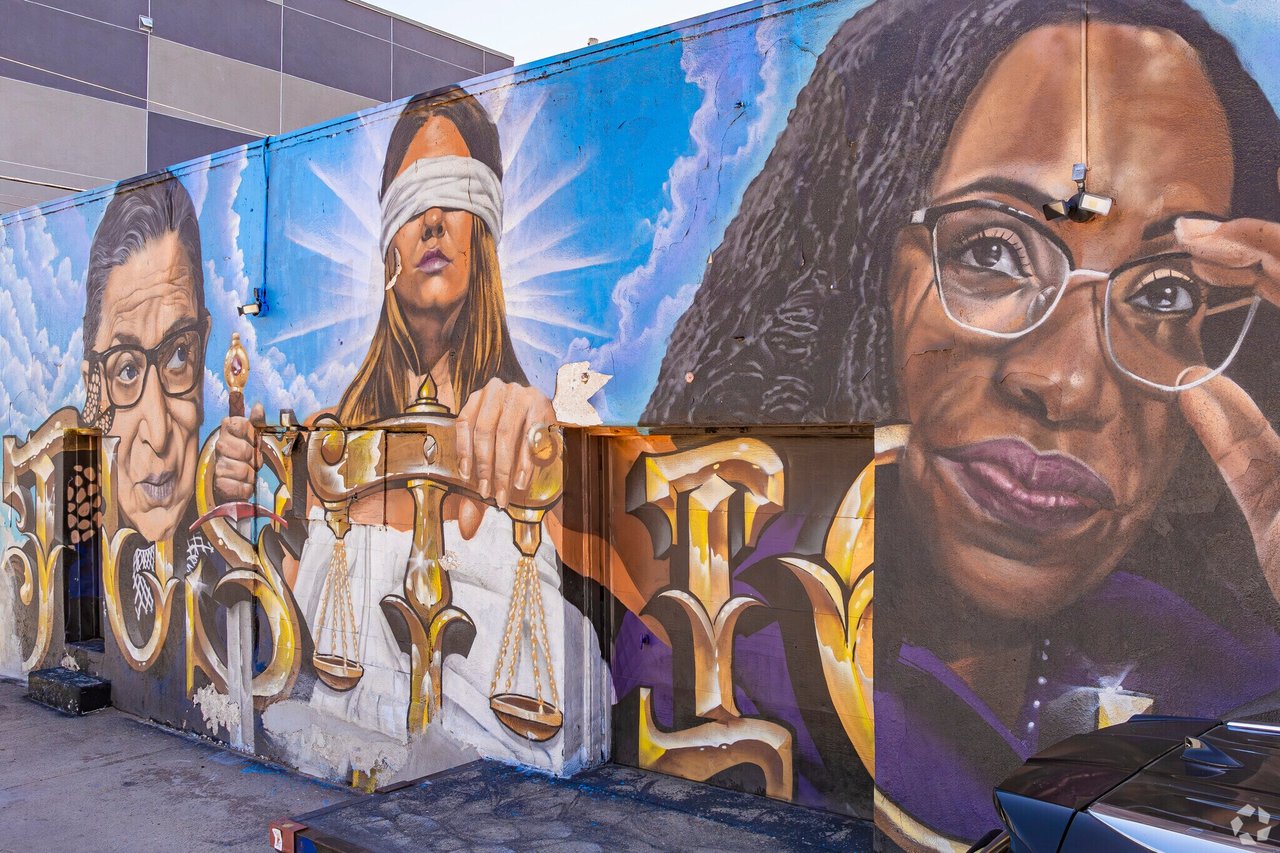
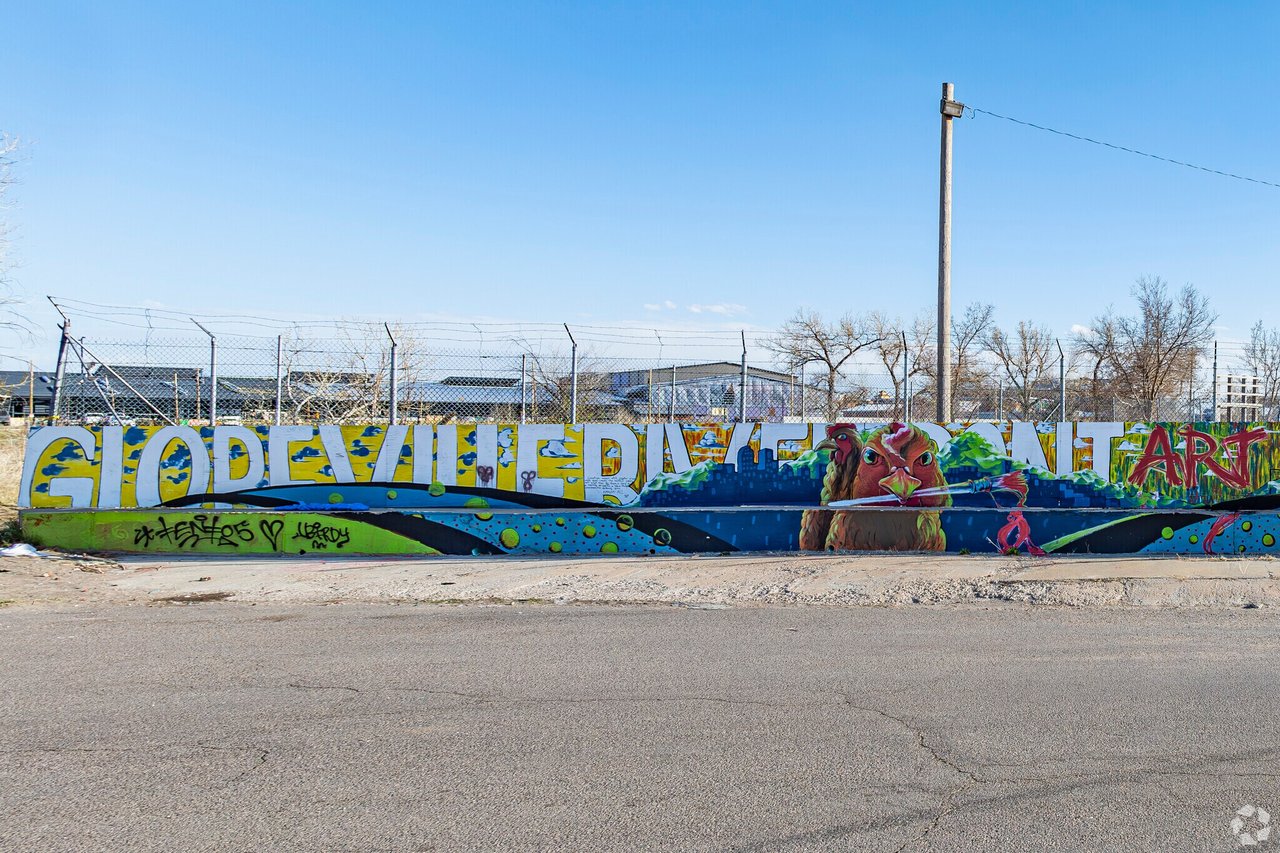
Cultural Heritage
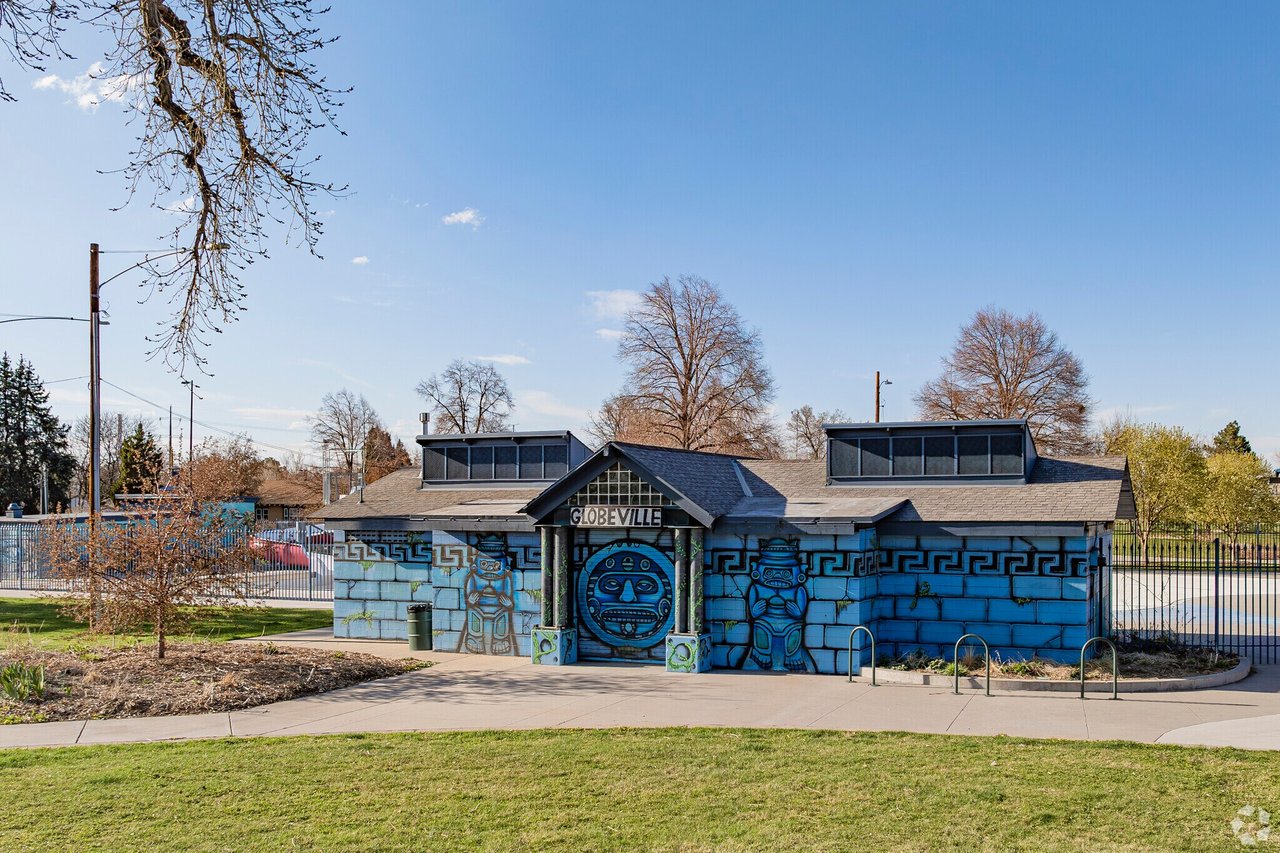
Originally shaped by waves of immigrant communities, Globeville’s cultural richness is visible in its local art, food, and festivals. Murals and historic landmarks reflect the area’s unique history and identity.
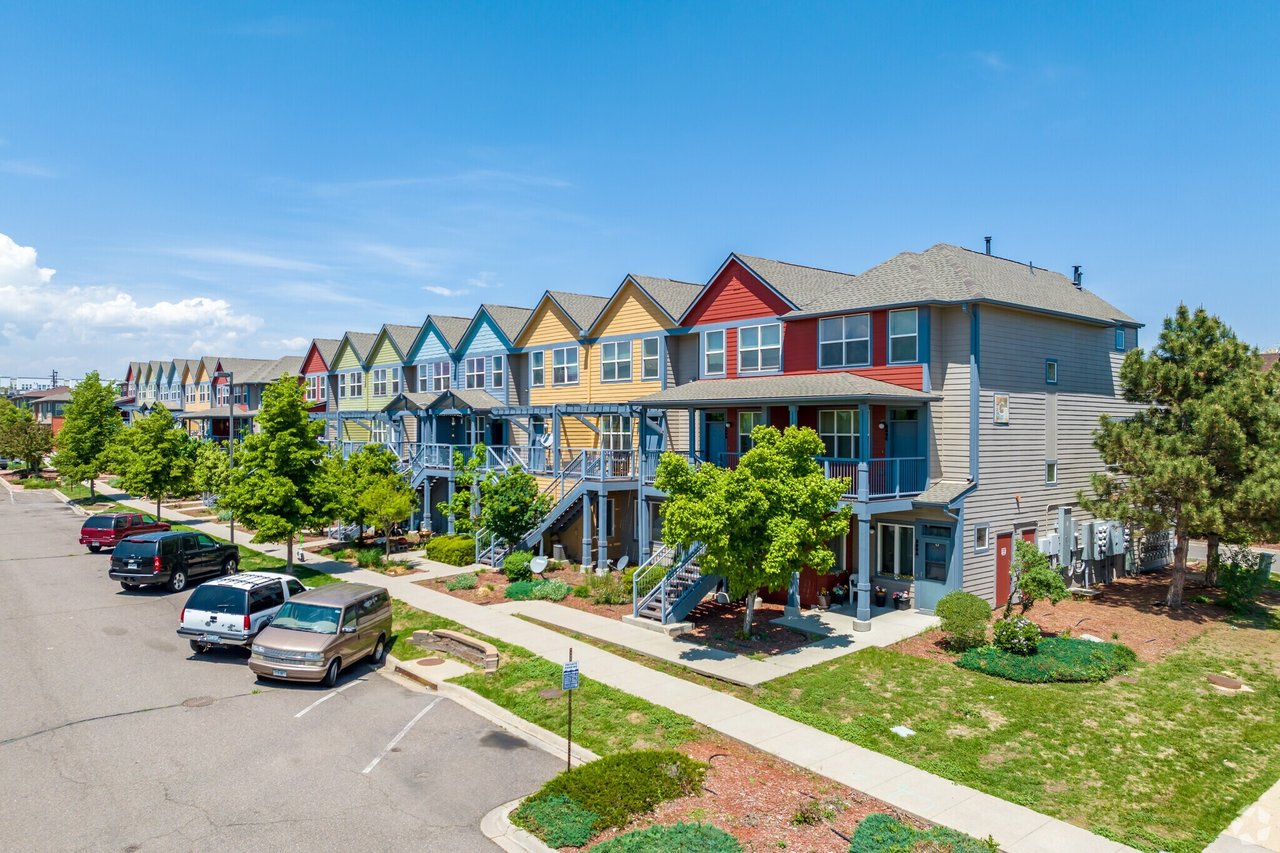
Emerging Developments
The neighborhood is undergoing revitalization, with new residential projects and businesses complementing its longstanding character and supporting community growth.
Community Engagement
Globeville residents actively participate in local associations, planning efforts, and events that build connection and advocate for thoughtful development.
Access to Nature
Proximity to the South Platte River, trails, and public parks makes outdoor recreation accessible, offering opportunities for walking, biking, and connecting with nature within an urban setting.
Strategic Location
Located near I-25 and I-70, the neighborhood offers quick access to downtown Denver, transit systems, and regional job centers.
Quick Facts
-
Established in the late 1800s as a railroad and industrial hub, Globeville has deep roots in Denver’s early development.
-
Hosts the annual Globeville Days festival, a celebration of music, culture, and community spirit.
-
Home to historic bridges, artistic installations, and public art that highlight its evolving identity.
-
Currently undergoing infrastructure improvements and land redevelopment aimed at enhancing neighborhood livability.
Local Resources
-
City of Denver: denvergov.org
-
Denver Parks and Recreation: denvergov.org/parks
-
Located in Denver County, Globeville benefits from a wide range of municipal services, community planning resources, and public spaces that support a vibrant and evolving urban neighborhood.